Financial condition and results
Financial position and operating results (consolidated)
-
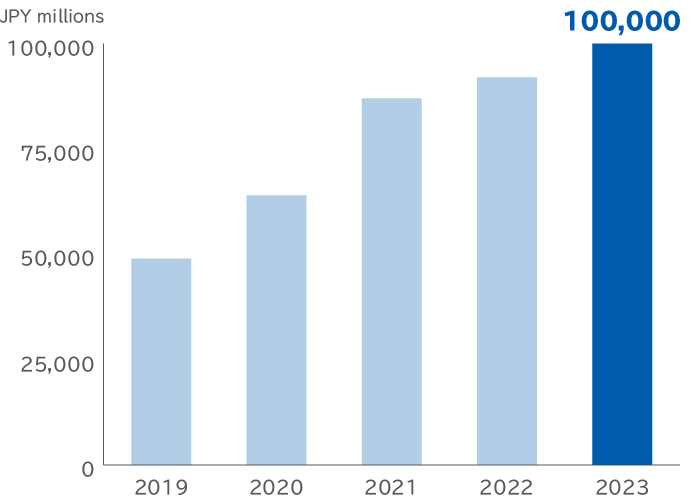
Net Sales

-
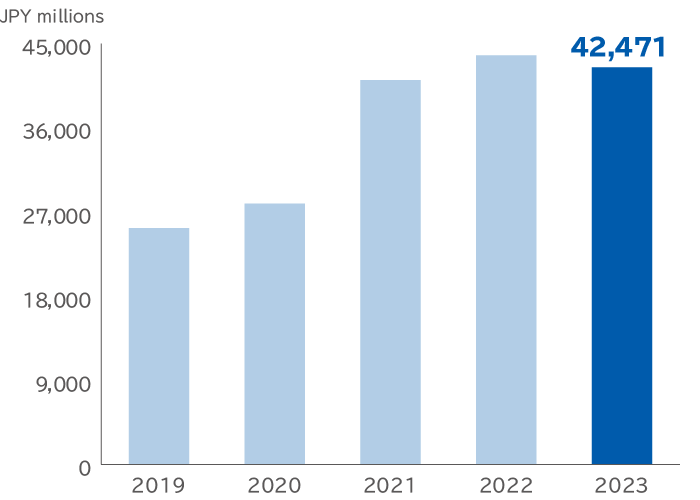
Operating Profit
-
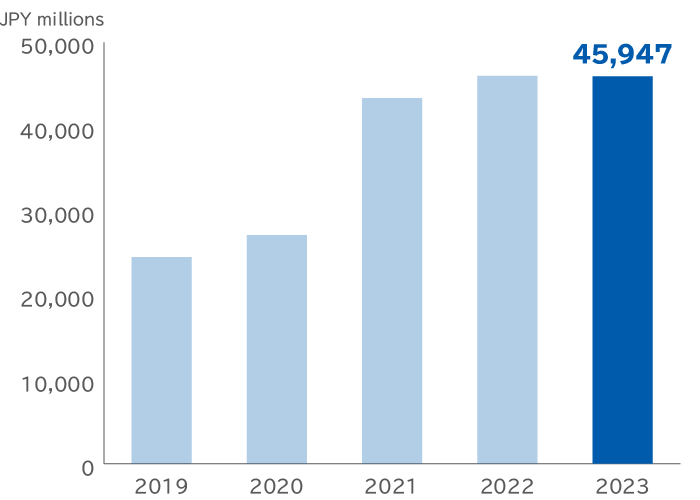
Ordinary Profit
-
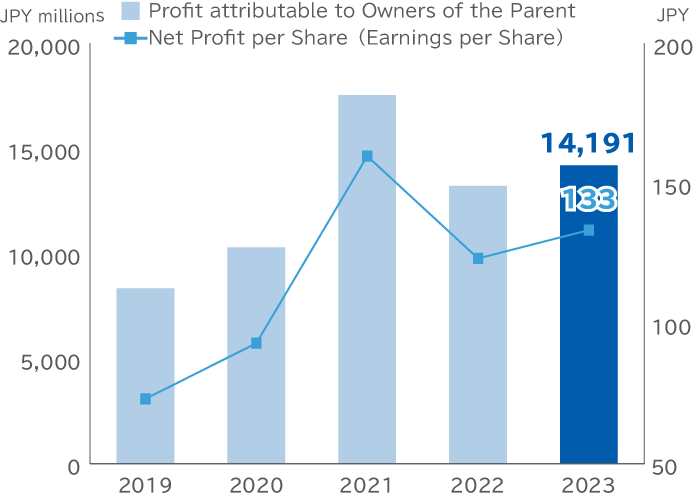
Profit attributable to Owners of the Parent
-
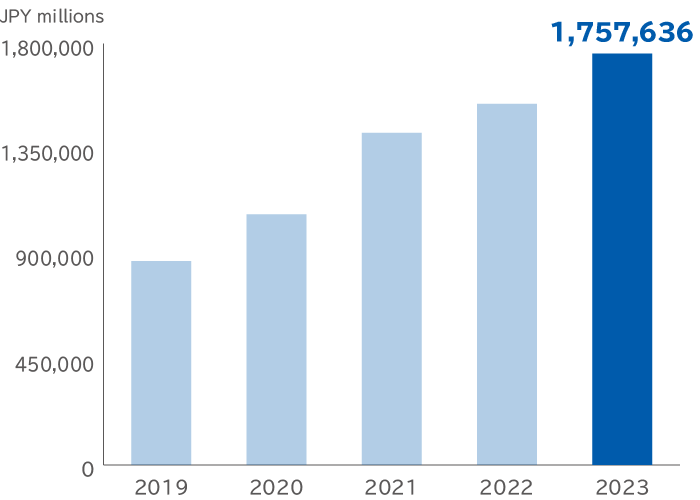
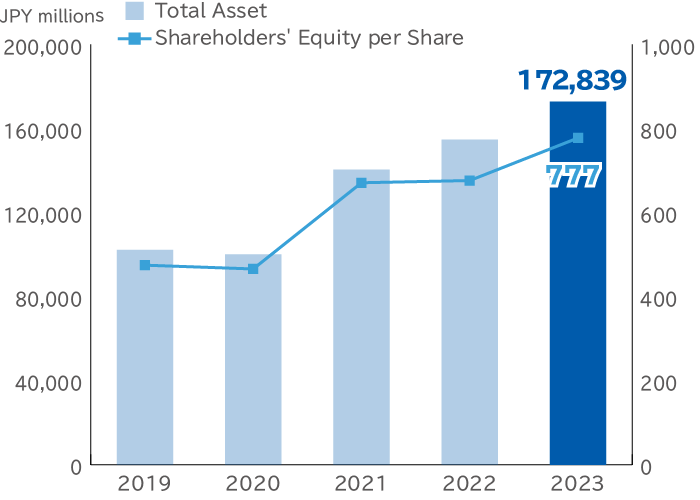
Total Asset
-
Net Asset
| 2020 | 2021 | 2022 | 2023 | 2024 | |
|---|---|---|---|---|---|
| Net Sales(JPY millions) | 210,559 | 241,612 | 245,696 | 258,643 | 277,407 |
| Operating Profit(JPY millions) | 27,893 | 41,164 | 43,746 | 42,471 | 46,653 |
| Ordinary Profit(JPY millions) | 27,136 | 43,393 | 46,025 | 45,947 | 46,565 |
| Profit attributable to Owners of the Parent(JPY millions) | 10,284 | 17,527 | 13,209 | 14,191 | 13,373 |
| Earnings per Share(JPY) | 93.00 | 159.69 | 123.21 | 133.33 | 126.54 |
| Total Asset(JPY millions) | 1,070,544 | 1,418,936 | 1,542,740 | 1,757,636 | 2,151,114 |
| Net Asset(JPY millions) | 100,114 | 140,402 | 154,688 | 172,839 | 190,047 |
| Shareholders' Equity per Share(JPY) | 465.94 | 670.99 | 676.28 | 777.50 | 825.10 |
Management indicators
-
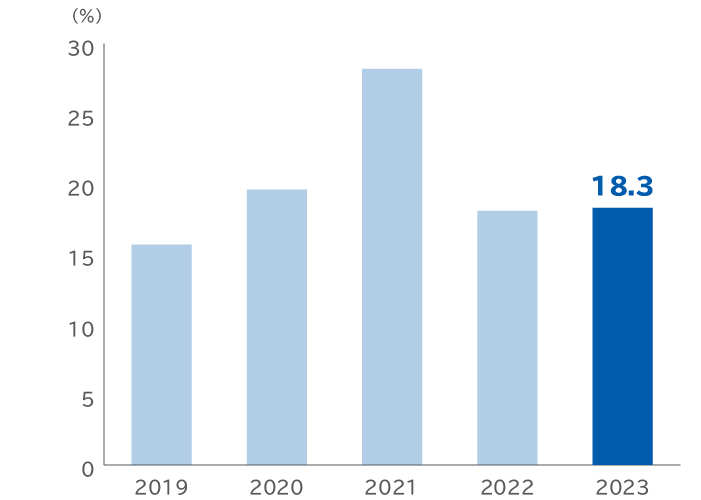
Return on Equity
-
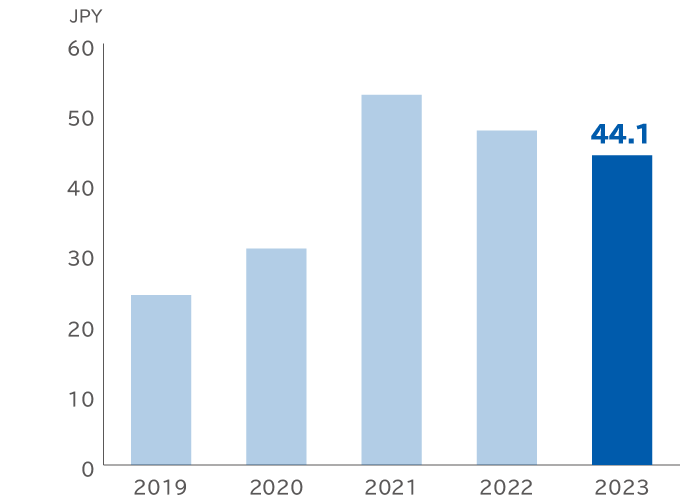
Dividends per Shrare
-
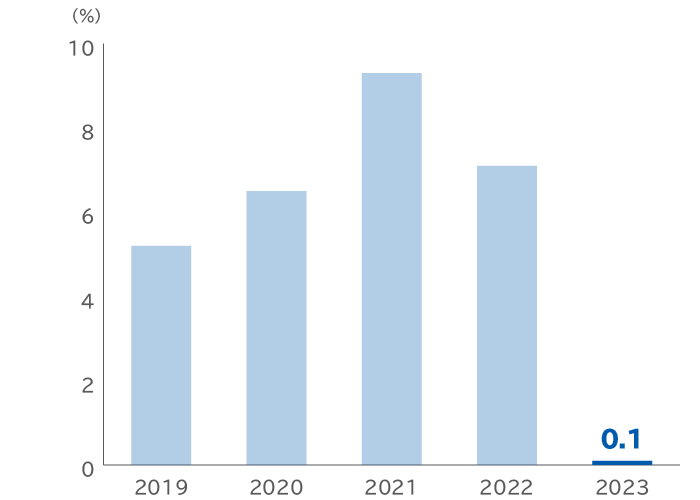
Dividend on Equity
-
Cash Flow from Operating Activities

-
Capital Expenditure
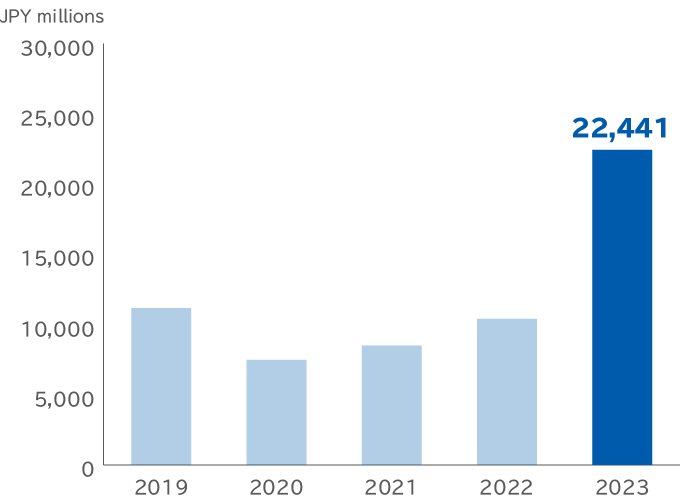
Note: Capital Expenditure = Acquisition of Tangible and Intangible Fixed Assets
-
Free Cash Flow
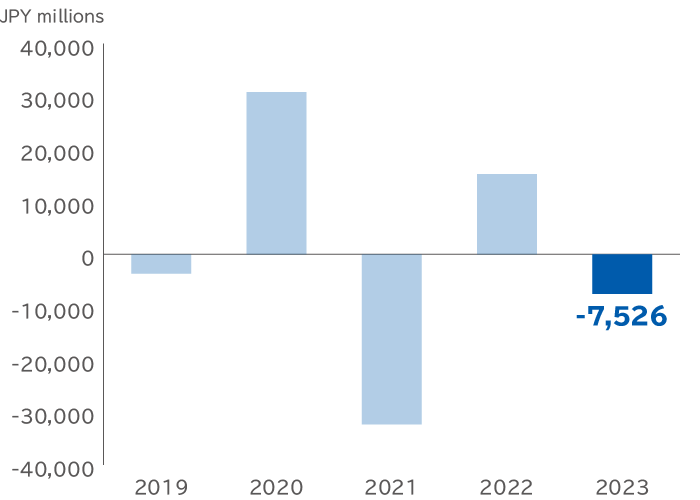
Note: Free Cash Flow = Cash Flow from Operating Activities – Capital Expenditure
| 2020 | 2021 | 2022 | 2023 | 2024 | |
|---|---|---|---|---|---|
| Return on Equity(%) | 19.6 | 28.2 | 18.1 | 18.3 | 15.8 |
| Dividends per Shrare (JPY) | 30.8 | 52.7 | 47.6 | 44.1 | 41.8 |
| Dividend on Equity (%) | 6.5 | 9.3 | 7.1 | 6.1 | 5.2 |
| Cash Flow from Operating Activities (JPY millions) | 38,277 | -23,783 | 25,641 | 14,914 | 84,735 |
| Capital Expenditure (JPY millions) | 7,486 | 8,496 | 10,402 | 22,441 | 30,966 |
| Free Cash Flow (JPY millions) |
30,790 | -32,279 | 15,239 | -7,526 | 53,769 |
Key business indicators
-
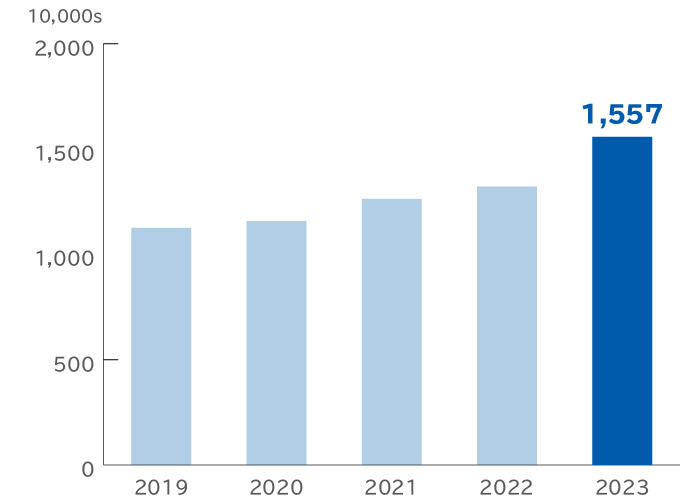
Contracts of InternetInfrastructure
-
Payment Transaction Volume
-
Financial accounts (stock, FX, cryptoassets)

-
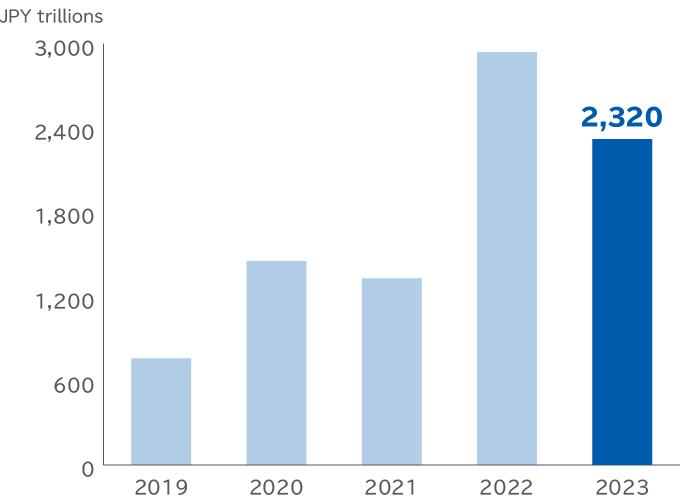
FX Trading volume
| 2020 | 2021 | 2022 | 2023 | 2024 | |
|---|---|---|---|---|---|
| Contracts of InternetInfrastructure (10000s) | 1,144 | 1,217 | 1,215 | 1,374 | 1,461 |
| Payment Transaction Volume(JPY trillions) | 6.4 | 8.7 | 12.2 | 15.8 | 19.8 |
| Financial accounts (stock, FX, cryptocurrency) (10000s) | 170.8 | 232.7 | 247.9 | 261.6 | 277.7 |
| FX Tading Volume(JPY trillions) | 1,452 | 1,328 | 2,940 | 2,323 | 2,954 |
Please refer to the Quarter Data Sheet of Financial Statements / Presentation Materials.

